> ## Documentation Index
> Fetch the complete documentation index at: https://velt.dev/docs/llms.txt
> Use this file to discover all available pages before exploring further.
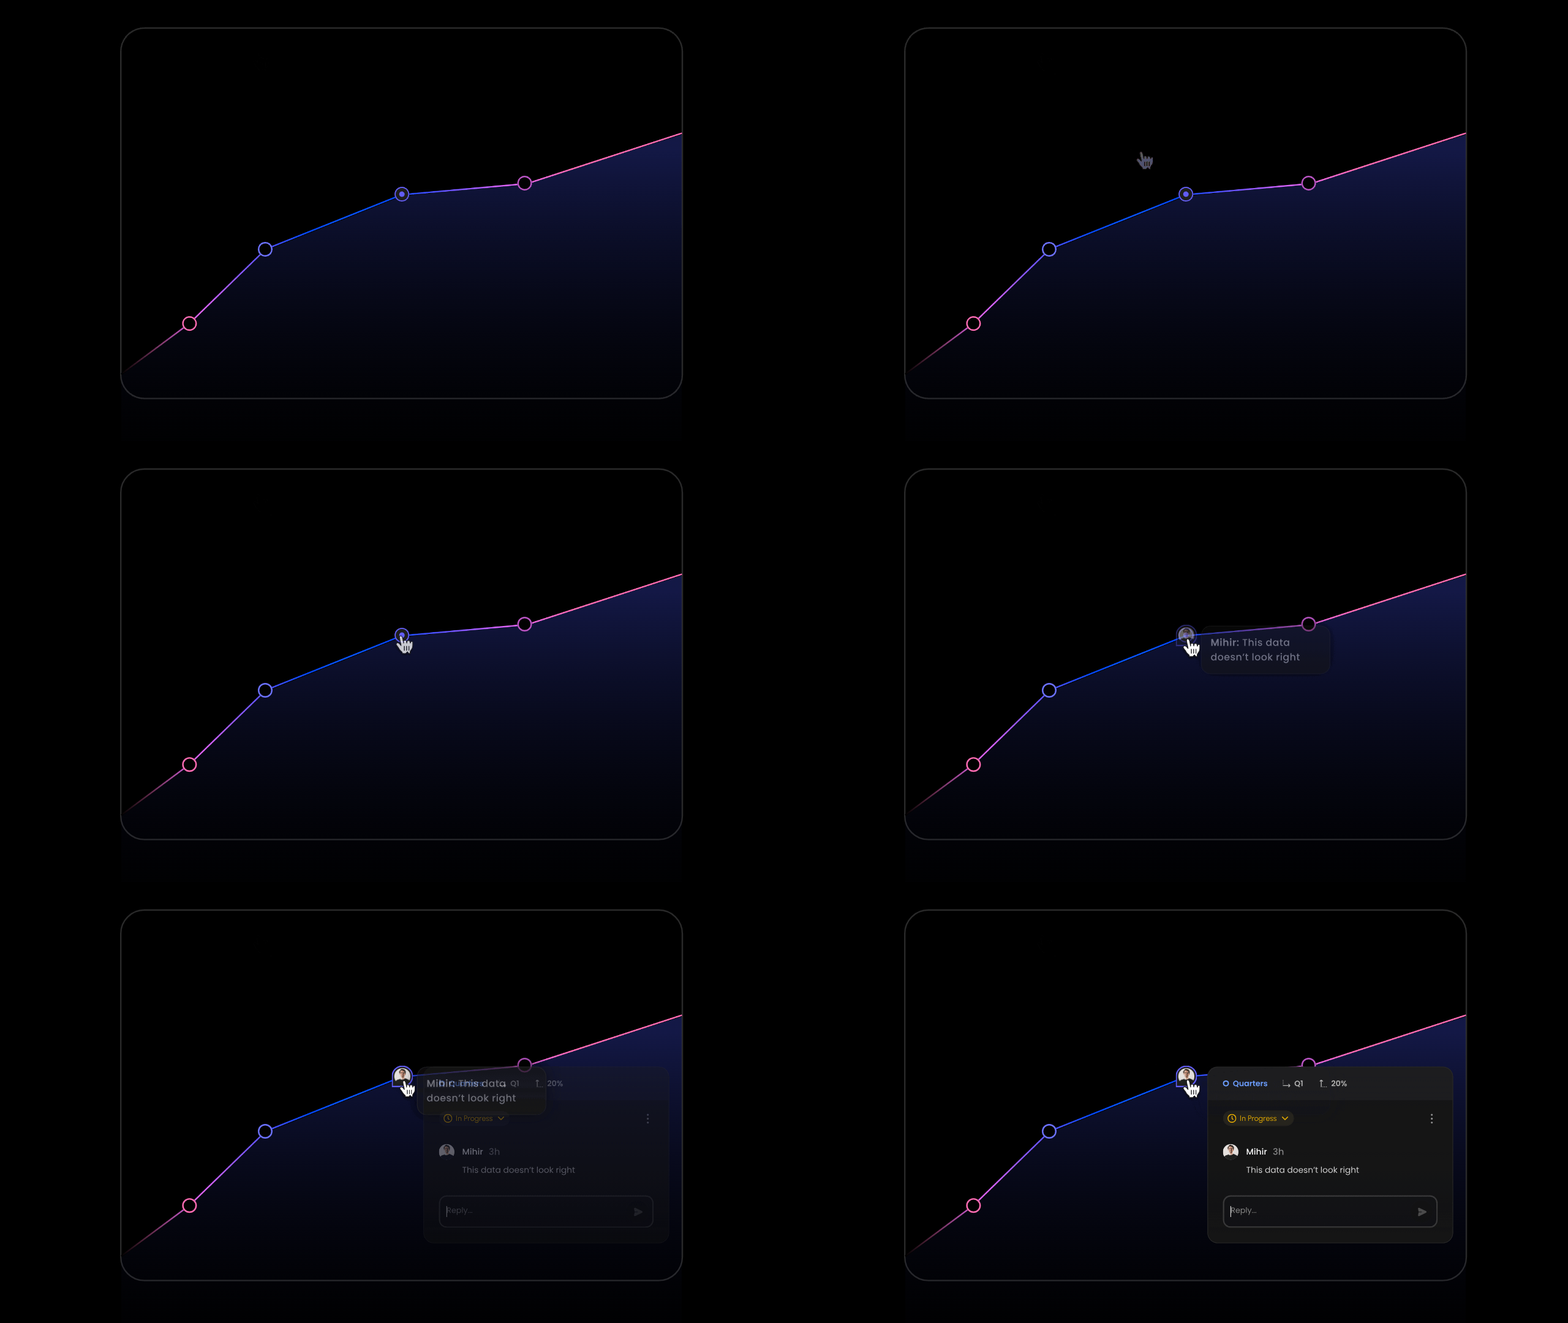
# NivoCharts Comments Setup
> [tab] React / Next.js
>
> ## 1. Import components from Nivo Charts
>
> ```jsx theme={null}
> import { ResponsiveLine } from '@nivo/line';
> ```
>
> ## 2. Import VeltNivoChartComments component from Velt
>
> * Add `VeltComments` once to the root of your app. This component is required to render comments in your app.
>
> ```jsx theme={null}
> import { VeltNivoChartComments, VeltComments } from '@veltdev/react';
> ```
>
> ## 3. Add a container div for the Nivo Chart component
>
> * Add a `nivo-chart-container` class to it. This will help us position the Velt Comment Pins accurately.
>
> ```jsx theme={null}
>
> data={data}
> layers={[
> 'grid', 'markers', 'axes', 'areas', 'crosshair',
> 'lines', 'slices', 'legends', 'points',
> ]}
> />
>
> ```
>
> ## 4. Add VeltNivoChartComments to the Nivo Chart component
>
> * Add a custom function as a layer inside your Nivo Chart component and return `VeltNivoChartComments` component.
> * Set a unique `id` in the VeltNivoChartComments component to scope comments to the specific chart, isolating them from other charts.
> * Pass the `chartComputedData` props to it.
>
> ```jsx theme={null}
> data={data}
> layers={[
> 'grid', 'markers', 'axes', 'areas', 'crosshair',
> 'lines', 'slices', 'legends', 'points',
> // Add this function with VeltNivoChartComments
> // component to allow Velt comments inside the Chart
> (chartComputedData) => {
> return (
>
> )
> }
> ]}
> />
> ```
>
> ## 5. (Optional) Customize the Chart Metadata displayed in the Comment Dialog
>
> * Pass an array to the `dialogMetadataTemplate` prop in the VeltHighChartsComments component.
> * This array determines the chart metadata displayed in the comment dialog, representing the data point (e.g., x-axis and y-axis values) on which the comment was added.
> * Customize the order of the keys or remove unnecessary keys to control how the metadata is presented in the comment dialog.
>
> `Default: ['groupId', 'label', 'value']`
>
> For example:
>
> ```jsx theme={null}
> id="NivoLineChartExample"
> chartComputedData={chartComputedData}
> dialogMetadataTemplate={['label', 'value', 'groupId']} />
> ```
> [tab] HTML (coming soon)
>
> Coming Soon
```js React / Next.js theme={null}
import { ResponsiveLine } from '@nivo/line';
import { VeltNivoChartComments } from '@veltdev/react';
import { useState } from 'react'
function YourComponent() {
const [data, setData] = useState(CHART_DATA);
return (
// add nivo-chart-container class to the parent element of your NivoChart
{
return (
)
}
]}
/>
)
}
```
This documentation is built and hosted on [Mintlify](https://mintlify.com), a developer documentation platform.